So Victor Iannello posted his latest paper on the Shah simulator data to Reddit. One has to wonder why, as an IG member in good standing, that it was not published on Duncan Steel's blog. The simple answer, IMO, as that Duncan is a zealot. He has long been suffering under the illusion that the fate of MH370 can be solved with a spreadsheet and pure analytics. He has steadfastly refused to consider human behavioral forensics as an acceptable investigative avenue. I am sure that Victor and Duncan remain friends. They are just divergent on what is relevant.
So it goes with the JW blog. It has largely been taken over by those who cling to the notion that it is somehow immoral and unacceptable to point the finger at Shah. Then we have Wise himself advocating the notion that agents of a sovereign state are running around the edges of the SIO planting debris.
I feel there is definitely a convergence taking place. The terminus is most likely in the 25S-27S range on the last range ring.
Monday, November 28, 2016
Monday, November 21, 2016
Public Service ??
sk999 recently (and generously) made a terrific info filled post on the JW blog. One of the many items posted were the orbital parameters for 3F1.
That document can be found here:
satellite.pdf
A Python (2.7) code implementation for computing satellite position and satellite velocity in the ECEF coordinate frame is copy pasted below:

Plain text below for copy/pasting into a file:
from math import pi,cos,sin
k = 15.041*2*pi/360 # radians per hour
rs = 42164.7 # km
i = 1.6401*2*pi/360
e = 0.00054
ut0 = 13.62 # decimal hours
utp = 7.607 # decimal hours
ut = input("time hrs.xx: ") # e.g. 00:11 input as 24.1833
nu = k*(ut-utp)
phi = k*(ut-ut0)
xr = rs*(1 + 0.25*i*i*(cos(2*phi) - 1) - e*cos(nu))
yr = rs*(-0.25*i*i*sin(2*phi) + 2*e*sin(nu))
z = rs*i*sin(phi)
vxr = rs*k*(-0.5*i*i*sin(2*phi) + e*sin(nu))
vyr = rs*k*(-0.5*i*i*cos(2*phi) + 2*e*cos(nu))
vz = rs*k*i*cos(phi)
# rotate xr, yr, vxr, vyr to ECEF
theta = 2*pi*64.516/360
x = xr*cos(theta) - yr*sin(theta)
y = xr*sin(theta) + yr*cos(theta)
vx = vxr*cos(theta) - vyr*sin(theta)
vy = vxr*sin(theta) + vyr*cos(theta)
print 'x:',"%0.1f" % x,'km'
print 'y:',"%0.1f" % y,'km'
print 'z:',"%0.1f" % z,'km'
# scale velocities from km/hr to km/sec
vx = vx/3600
vy = vy/3600
vz = vz/3600
print 'x_dot:',"%0.5f" % vx,'km/sec'
print 'y_dot:',"%0.5f" % vy,'km/sec'
print 'z_dot:',"%0.5f" % vz,'km/sec'
That document can be found here:
satellite.pdf
A Python (2.7) code implementation for computing satellite position and satellite velocity in the ECEF coordinate frame is copy pasted below:

POR parameters:
lsat = 178.078 deg
i = 1.0354 deg
e = 0.000519
rs = 42164.2 km
uto = 6.418 hr
utp = 0.0689 hr
lsat = 178.078 deg
i = 1.0354 deg
e = 0.000519
rs = 42164.2 km
uto = 6.418 hr
utp = 0.0689 hr
Victor - 6 June 2017
Plain text below for copy/pasting into a file:
from math import pi,cos,sin
k = 15.041*2*pi/360 # radians per hour
rs = 42164.7 # km
i = 1.6401*2*pi/360
e = 0.00054
ut0 = 13.62 # decimal hours
utp = 7.607 # decimal hours
ut = input("time hrs.xx: ") # e.g. 00:11 input as 24.1833
nu = k*(ut-utp)
phi = k*(ut-ut0)
xr = rs*(1 + 0.25*i*i*(cos(2*phi) - 1) - e*cos(nu))
yr = rs*(-0.25*i*i*sin(2*phi) + 2*e*sin(nu))
z = rs*i*sin(phi)
vxr = rs*k*(-0.5*i*i*sin(2*phi) + e*sin(nu))
vyr = rs*k*(-0.5*i*i*cos(2*phi) + 2*e*cos(nu))
vz = rs*k*i*cos(phi)
# rotate xr, yr, vxr, vyr to ECEF
theta = 2*pi*64.516/360
x = xr*cos(theta) - yr*sin(theta)
y = xr*sin(theta) + yr*cos(theta)
vx = vxr*cos(theta) - vyr*sin(theta)
vy = vxr*sin(theta) + vyr*cos(theta)
print 'x:',"%0.1f" % x,'km'
print 'y:',"%0.1f" % y,'km'
print 'z:',"%0.1f" % z,'km'
# scale velocities from km/hr to km/sec
vx = vx/3600
vy = vy/3600
vz = vz/3600
print 'x_dot:',"%0.5f" % vx,'km/sec'
print 'y_dot:',"%0.5f" % vy,'km/sec'
print 'z_dot:',"%0.5f" % vz,'km/sec'

Monday, November 14, 2016
Path to the Cocos
So, the simulator points found on Shah's shadow drive (and deleted) are quite interesting, and beg for an explanation. Recently Iannello and Godfrey speculated that the terminal points (~45S ~104E) might have been the result of selecting McMurdo Station in Antarctic as a destination. Of course, the aircraft ran out of fuel before reaching McMurdo at the 45S 104E points found on the simulator. The question addressed by Iannello and Godfrey is where would MH370 terminate on the 7th arc using McMurdo as a destination. That work can be found here.
Iannello and Godfrey - McMurdo
Another way to look at the same question is to postulate that the Cocos were used as a destination in Shah's simulation, and the aircraft simply continued past the Cocos and ran out of fuel. This short note takes a quick look at how that scenario plays out.
The track, great circle, from the 19:40 range ring to the Cocos is shown below (green line). The track was extended past the Cocos maintaining the great circle trajectory,

The small "star" North and West of the "4" range ring marker denotes the Cocos.
For simplicity a fixed ground speed of 480knots and a fixed track of 169 degrees was used to create the path. The details associated with this choice are shown in the spreadsheet below. A late FMT was used in this path as was used by Iannello and Godfrey.

Obviously refinements can (and should) be made using wind, mach number, air temperature, and magnetic heading (as opposed to true track) after the Cocos. Those refinements can be added later. This effort was intended to be a "quick look".
As is my custom, I stopped the calculations at 00:11. The 00:11 location is 27.1S and 101.1E. The Iannello and Godfrey 00:11 location using McMurdo station as a destination is 26.08S 100.36E. I would characterize the BFO errors associated with the Cocos destination as comparable to the errors obtained by Iannello and Godfrey using McMurdo as a destination.
It should be noted that if the great circle is extended to ~45S the corresponding latitude is ~105E.
Update: 24 November 2016
A recent publication by Mike Chillit suggests a terminus near the Batavia Seamount based on flight path and drifter considerations. That paper can be found at the link below.
Mike Chillit - Batavia Seamount
A screen capture of a graphic from the linked paper shows the suggested terminus below.

The Batavia Seamount location (25.75S 100.33E) is added to my flightpath derived above in the graphic below. The Batavia Seamount is approximately 80nm North of my derived terminus.

An interesting take-away from the Chillit paper is the drifter data he includes. I had not seen or been aware of this data previously. It certainly lends credibility to the terminal locations above.
A close-up of the above with the Iannello and Godrey McMurdo based terminus (pin labeled I&G) is shown below.

Drifter summary from referenced Chillit post.

Iannello and Godfrey - McMurdo
Another way to look at the same question is to postulate that the Cocos were used as a destination in Shah's simulation, and the aircraft simply continued past the Cocos and ran out of fuel. This short note takes a quick look at how that scenario plays out.
The track, great circle, from the 19:40 range ring to the Cocos is shown below (green line). The track was extended past the Cocos maintaining the great circle trajectory,

The small "star" North and West of the "4" range ring marker denotes the Cocos.
For simplicity a fixed ground speed of 480knots and a fixed track of 169 degrees was used to create the path. The details associated with this choice are shown in the spreadsheet below. A late FMT was used in this path as was used by Iannello and Godfrey.

As is my custom, I stopped the calculations at 00:11. The 00:11 location is 27.1S and 101.1E. The Iannello and Godfrey 00:11 location using McMurdo station as a destination is 26.08S 100.36E. I would characterize the BFO errors associated with the Cocos destination as comparable to the errors obtained by Iannello and Godfrey using McMurdo as a destination.
It should be noted that if the great circle is extended to ~45S the corresponding latitude is ~105E.
Update: 24 November 2016
A recent publication by Mike Chillit suggests a terminus near the Batavia Seamount based on flight path and drifter considerations. That paper can be found at the link below.
Mike Chillit - Batavia Seamount
A screen capture of a graphic from the linked paper shows the suggested terminus below.

The Batavia Seamount location (25.75S 100.33E) is added to my flightpath derived above in the graphic below. The Batavia Seamount is approximately 80nm North of my derived terminus.

A close-up of the above with the Iannello and Godrey McMurdo based terminus (pin labeled I&G) is shown below.

Drifter summary from referenced Chillit post.

Friday, November 11, 2016

Cellphone Connect
It has been rumored for some time that Fariq Hamid's (MH370 FO) cellphone connected to a tower near Penang. A page from the Malaysian Police investigation recently appeared in the public domain (se JW blog) stating that the connection indeed took place to a Celcom basestation located at Banda Baru Air Itam. It was further stated that this basestation has a range of 32km.
Graphic below shows the location of this basestation along with other points of interest. The black circle in the graphic has a radius of 32km.
Edit 16Nov16
The time of the registration (~17:52) coupled with the time and distance to the last radar contact (18:22 and 250 nm respectively) suggest that the average speed of the aircraft over that distance was -500 knots). That in turn would imply the registration occurred when the aircraft was above 20,000 feet.


Graphic below shows the location of this basestation along with other points of interest. The black circle in the graphic has a radius of 32km.
Edit 16Nov16
The time of the registration (~17:52) coupled with the time and distance to the last radar contact (18:22 and 250 nm respectively) suggest that the average speed of the aircraft over that distance was -500 knots). That in turn would imply the registration occurred when the aircraft was above 20,000 feet.


Sunday, November 6, 2016
Screen Capture MacPro MH370 "Stickies"
What we know with VERY HIGH confidence.
(click image to enlarge)

(click image to enlarge)

Sunday, October 30, 2016
BTO Games
The SDU reboot at 18:xx has been the subject of a great deal of discussion. SDU reboots are rare. In the 20 previous flights of 9M-MRO studied by the DSTG no mention was made of any observed reboots. Most of the reboot discussions were to address the question of causality - what happened to require and to initiate the reboot. The purpose of this narrative is not to address causality, but rather to address a possible consequence. I found the following statement on page 26 of the DSTG "Bayesian Methods..." book to be interesting.


Obviously displaced ping rings after the reboot at 18:xx completely change terminal locations derived by everyone to date. I am not suggesting that this conjecture is anything but conjecture, but it does support the range and azimuth numbers shown in the Beijing Lido Hotel graphic.
It is also possible that only the 18:25:27 range ring is corrupted since subsequent range rings are derived from R1200 channels where the additional divide by two ambiguity does not exist, at least relative to that counter chain.
Once again, data from the previous flights would be enormously helpful to determine if the variation in BTO bias on R600 channels observed in those flights is quantized near a symbol period of the R1200 channel. Recall that with 1/2 rate FEC encoding the symbol period is 1/2400 second.
EDIT 10/31/16
Checking the BFO value at 18:25:27 for the location, speed, and track derived above.
The measured BFO of 142Hz has an associated BFO residual of 17.6Hz
Using:
speed = 411knots
track = 295 @ 7N 96.8E
yields a BFO residual of 13.5Hz or a predicted BFO of 138Hz (4Hz error).
EDIT 11/1/16
Graphic below was created from Figure 4.1 of "Bayesian Methods...". The DSTG final radar contact was carefully estimated as 6.6N 96.3E by overlaying the image in Google Earth. The DSTG last contact shown is at ~250nm (maximum range of RAT31DL radar at Penang Hill) on a ~287degree radial. The Penang Hill radar horizon at 250nm corresponds to approximately a 23,000 feet aircraft altitude. The standard 18:25 range ring is located 27nm further along the 287 degree radial (black line). Implied aircraft ground speed compatible with reaching the 18:25 ring on time is is ~463 knots. Approximate location of ring crossing is 6.7N 95.8E.

Again the measured BFO of 142Hz has an associated BFO residual of 17.6Hz
Using:
speed = 463knots
track = 287 @ 6.7N 95.8E
yields a BFO residual of 10Hz or a predicted BFO of 134.4Hz (7.6Hz error).
Alternatively, the aircraft may have turned slightly to the North at Mekar to follow the air corridor to Nilam. This turn would result in a heading of 296 degrees.
Using:
speed = 510 knots (DSTG ground speed estimate)
track = 296 @6.8N 95.9E
yields a BFO residual of 17.7Hz or a predicted BFO of 142Hz (virtually no error).
This scenario would seem to be the most likely.
It should be noted that at the DSTG estimated ground speed of 510 knots the aircraft will over-shoot the 18:25 range ring by about 25km (probably no big deal).
The channel dependent calibration term T_channel is assumed to be constant over a single flight but can vary between flights. A fixed value for each flight assessed was empirically derived by comparing the communications logs with known aircraft positions: the calculated value of T_channel was the mean difference between the measured BTO and the expected BTO calculated using the known aircraft location.
The so-called T_channel calibration term is a component of the BTO bias used to convert the BTO log data to total range (Perth GES to satellite + satellite to aircraft) from the ground station to the aircraft. This range is then used to produce the "ping rings" denoting a locus of possible locations of the aircraft at the "ping" times.
If the T_channel calibration changes ("can vary") from flight to flight, what is to prevent such a variation occurring as a result of an SDU reboot? There is no way to determine the value of the BTO bias after the aircraft went dark near IGARI. The ACARS data which provides aircraft position remained off, and the radar information (such as it is) does not overlap any ping rings.
Another statement from page 26 of "Bayesian Methods..." below.
A fixed value for each flight assessed was empirically derived by comparing the communications logs with known aircraft positions: the calculated value of T_channel was the mean difference between the measured BTO and the expected BTO calculated using the known aircraft location. For the accident flight this calibration is only available for the time when the plane was at the tarmac and for the first half hour of flight.
The so-called T_channel calibration term is a component of the BTO bias used to convert the BTO log data to total range (Perth GES to satellite + satellite to aircraft) from the ground station to the aircraft. This range is then used to produce the "ping rings" denoting a locus of possible locations of the aircraft at the "ping" times.
If the T_channel calibration changes ("can vary") from flight to flight, what is to prevent such a variation occurring as a result of an SDU reboot? There is no way to determine the value of the BTO bias after the aircraft went dark near IGARI. The ACARS data which provides aircraft position remained off, and the radar information (such as it is) does not overlap any ping rings.
Another statement from page 26 of "Bayesian Methods..." below.
A fixed value for each flight assessed was empirically derived by comparing the communications logs with known aircraft positions: the calculated value of T_channel was the mean difference between the measured BTO and the expected BTO calculated using the known aircraft location. For the accident flight this calibration is only available for the time when the plane was at the tarmac and for the first half hour of flight.
There is really no way to know if the assumption of a constant BTO bias is a valid assumption, particularly after an SDU reboot. Any device with multiple counter chains can initialize in a number of different states. Synchronizing all the counter chains can certainly be done, but it does require some overhead in the design, and is not usually done unless there is a functional reason for doing so. Note that the 18:25:27 BTO is derived from an R600 channel whereas all the other BTO's are derived from R1200 channels. The clock timing ambiguity associated with a simple divide by two is shown below. There are two equally likely possibilities based on how the counter chain initializes. The two states differ in phase by one clock period of the reference. See figure below.


The radar information (note I am not using the word data because radar data has never been placed in the public domain) we have adds more confusion to this situation than clarity. In particular, consider the radar graphic below presumably captured by the Malay radar on Penang Hill. This graphic was shown to the Chinese NOK in the now infamous Beijing LIDO Hotel presentation.

This graphic has been used extensively by independent analysts in an attempt to characterize the flight path of 9M-MRO after it crossed the Malay Peninsula. Of particular interest is the time stamped information in the box at the upper left of the figure. The time 02:22 is 8:22 UTC. The 295R is the azimuth angle from Penang Hill, and the 200nm is the range. Analysts were quick to recognize that this figure, in particular the information in the box at the upper left, could not be reconciled with the Inmarsat data (the 18:25 ping ring) nor did the track conform to normal air "corridors". As a result, the data in the box was declared to be in error, and the graphic was morphed in various ways to conform to air corridors in the region. The area inside the white circle has been the subject of various conjectures relative to why the track is missing in that region.
Consider the Google Earth graphic below which shows the above area along with labeled range rings, in particular the 18:25 ring. The graphic also includes a 295R/200nm radial from Penang Hill (the yellow line, and various points of interest such as the Kota Bharu "sighting" location, and the position of Kate's (the saucy sailoress) boat. The white horizontal line connecting the end of the Penang Hill radial to the 18:25 range ring has a length of 145km (78.6nm).

The precise time of the 18:25 ring is 18:25:27. Suffice to say that a 777 cannot fly 145km in 3 minutes and 27 seconds (18:22 to 18:25:27). So obviously the time stamped information in the Lido Hotel graphic must be wrong since the range ring is assumed to be correct. I also believe this interpretation of the information is probably correct.
However, there is an alternative explanation. The alternative binary is that the 18:25 range ring is incorrect as a result of a change in BTO bias induced by the SDU reboot. What value might be assigned to the BTO bias is the next obvious question. Again resorting to "Bayesian Methods..." page 26:
For some communication messages, typically during initial log-on, there was a very large difference between the measured
BTO and the nominal delay. Analysis showed that rather than simple outliers, these
anomalous BTO measurements could be corrected by a factor of N × 7,820 μs
where N is a positive integer.
What if the BTO bias was increased by 7820us, and that this increase persisted for the remainder of the flight up to the 19:xx reboot where another bias change opportunity would present itself? That would move the 18:25 range ring in the direction of end of the 295R/200nm radial, and the new distance to the range ring might be compatible with a flight time from 18:22 to 18:25:27.
A detailed calculation for the 18:25 range ring radius was performed elsewhere in this blog. See link below:
Calculation of 18:25 ring using KL BTO bias
The calculations in the link use the BTO bias of 495679us derived from tarmac measurements prior to take-off at Kuala Lumpur. What if this calculation were done again with 7820us added i.e. with a BTO bias of 503499us? A 18:25 range ring based on this BTO bias has radius of 5184km compared to the unmodified BTO bias range ring radius of 3526km. A radius increase this large is clearly not at all compatible with the radar information. Looking at other possibilities in the absence of data from previous flights, one is tempted to use a bias increase corresponding to one symbol of the IOR-R1200 slotted Aloha protocol used in the R-channel. All packet channels use 1/2 rate forward error correction, so the symbol period is 1/2400. This choice results in delay increase of 417us to a BTO bias of 496096us versus the KL measured bias of 495679. See clock phase ambiguity figure shown earlier. The resulting 18:25 ping ring radius is 3634km or about 108km larger. This value is a promising candidate.
The graphic below depicts the Google Earth view as above with the 18:25 and 19:40 range rings based on the 496096 BTO bias drawn in green. The distance to the revised 18:25 range ring (7N 96.8E) is 23nm along a 295 degree azimuth from the 200nm stated radial range end point. To cover this distance in 3.5 minutes would imply an aircraft speed of approximately 411 knots. This speed coincides with the most probable speed derived by the DSTG for the Southern track after the FMT at 19:40. See also the Mid-flight Speed post elsewhere in this blog.
mid-flight speed MH370
Note the the revised 19:40 range ring goes just about over the top of Kate's boat. Kate's boat is at approximately 6.5N 94.5E in the graphic below. It certainly reinvigorates the possibility that Kate could have seen the aircraft at very close range. Additionally this location is very close to locations posited for the late FMT needed to support terminal locations further to the North and East of the current priority search zone.

What if the BTO bias was increased by 7820us, and that this increase persisted for the remainder of the flight up to the 19:xx reboot where another bias change opportunity would present itself? That would move the 18:25 range ring in the direction of end of the 295R/200nm radial, and the new distance to the range ring might be compatible with a flight time from 18:22 to 18:25:27.
A detailed calculation for the 18:25 range ring radius was performed elsewhere in this blog. See link below:
Calculation of 18:25 ring using KL BTO bias
The calculations in the link use the BTO bias of 495679us derived from tarmac measurements prior to take-off at Kuala Lumpur. What if this calculation were done again with 7820us added i.e. with a BTO bias of 503499us? A 18:25 range ring based on this BTO bias has radius of 5184km compared to the unmodified BTO bias range ring radius of 3526km. A radius increase this large is clearly not at all compatible with the radar information. Looking at other possibilities in the absence of data from previous flights, one is tempted to use a bias increase corresponding to one symbol of the IOR-R1200 slotted Aloha protocol used in the R-channel. All packet channels use 1/2 rate forward error correction, so the symbol period is 1/2400. This choice results in delay increase of 417us to a BTO bias of 496096us versus the KL measured bias of 495679. See clock phase ambiguity figure shown earlier. The resulting 18:25 ping ring radius is 3634km or about 108km larger. This value is a promising candidate.
The graphic below depicts the Google Earth view as above with the 18:25 and 19:40 range rings based on the 496096 BTO bias drawn in green. The distance to the revised 18:25 range ring (7N 96.8E) is 23nm along a 295 degree azimuth from the 200nm stated radial range end point. To cover this distance in 3.5 minutes would imply an aircraft speed of approximately 411 knots. This speed coincides with the most probable speed derived by the DSTG for the Southern track after the FMT at 19:40. See also the Mid-flight Speed post elsewhere in this blog.
mid-flight speed MH370
Note the the revised 19:40 range ring goes just about over the top of Kate's boat. Kate's boat is at approximately 6.5N 94.5E in the graphic below. It certainly reinvigorates the possibility that Kate could have seen the aircraft at very close range. Additionally this location is very close to locations posited for the late FMT needed to support terminal locations further to the North and East of the current priority search zone.

Obviously displaced ping rings after the reboot at 18:xx completely change terminal locations derived by everyone to date. I am not suggesting that this conjecture is anything but conjecture, but it does support the range and azimuth numbers shown in the Beijing Lido Hotel graphic.
It is also possible that only the 18:25:27 range ring is corrupted since subsequent range rings are derived from R1200 channels where the additional divide by two ambiguity does not exist, at least relative to that counter chain.
Once again, data from the previous flights would be enormously helpful to determine if the variation in BTO bias on R600 channels observed in those flights is quantized near a symbol period of the R1200 channel. Recall that with 1/2 rate FEC encoding the symbol period is 1/2400 second.
EDIT 10/31/16
Checking the BFO value at 18:25:27 for the location, speed, and track derived above.
The measured BFO of 142Hz has an associated BFO residual of 17.6Hz
Using:
speed = 411knots
track = 295 @ 7N 96.8E
yields a BFO residual of 13.5Hz or a predicted BFO of 138Hz (4Hz error).
EDIT 11/1/16
Graphic below was created from Figure 4.1 of "Bayesian Methods...". The DSTG final radar contact was carefully estimated as 6.6N 96.3E by overlaying the image in Google Earth. The DSTG last contact shown is at ~250nm (maximum range of RAT31DL radar at Penang Hill) on a ~287degree radial. The Penang Hill radar horizon at 250nm corresponds to approximately a 23,000 feet aircraft altitude. The standard 18:25 range ring is located 27nm further along the 287 degree radial (black line). Implied aircraft ground speed compatible with reaching the 18:25 ring on time is is ~463 knots. Approximate location of ring crossing is 6.7N 95.8E.

Again the measured BFO of 142Hz has an associated BFO residual of 17.6Hz
Using:
speed = 463knots
track = 287 @ 6.7N 95.8E
yields a BFO residual of 10Hz or a predicted BFO of 134.4Hz (7.6Hz error).
Alternatively, the aircraft may have turned slightly to the North at Mekar to follow the air corridor to Nilam. This turn would result in a heading of 296 degrees.
Using:
speed = 510 knots (DSTG ground speed estimate)
track = 296 @6.8N 95.9E
yields a BFO residual of 17.7Hz or a predicted BFO of 142Hz (virtually no error).
This scenario would seem to be the most likely.
It should be noted that at the DSTG estimated ground speed of 510 knots the aircraft will over-shoot the 18:25 range ring by about 25km (probably no big deal).
Monday, October 3, 2016
SBIRS Coverage Map
SBIRS stands for the US Space Based Infrared System designed to detect heat signatures produced by rocket launches.

Does the US intelligence community know where MH370 terminated??
Cut and paste below from October 2015 Aviation Week.

Does the US intelligence community know where MH370 terminated??
Cut and paste below from October 2015 Aviation Week.
Sbirs data has also been used by U.S. intelligence officials as they continue to unravel the mystery of Malaysia Airlines Flight 370 (MH370), another 777-200ER, that disappeared in March 2014 while en route from Kuala Lumpur to Beijing. According to information from Malay military radar, the aircraft is thought to have crossed the Malayan peninsula and possibly crashed into the Indian Ocean. A flaperon belonging to the aircraft later washed up on the French overseas territory of Reunion Island in the Indian Ocean. The aircraft is thought to have flown in an area not highly trafficked, making it easier for Sbirs to find and track the heat signature of a 777-200ER.
Officials at the 460th declined to articulate their role in the search, and U.S. intelligence is unlikely to advertise if and how its data was used, for fear of revealing its capabilities. But Jackson says the team did participate by providing technical data to the intelligence community.
Tuesday, September 27, 2016
Oscillator Comments Holding Area
A family of random walks is shown below - as would be obtained by "integrating" coin flips e.g. a head you move up, a tail you move down. Graph shows progress after 100 flips. The walk was repeated eight times to create the graphic below.

A "blizzard" of trials below illustrate a zero ensemble mean and a variance that grows with time.

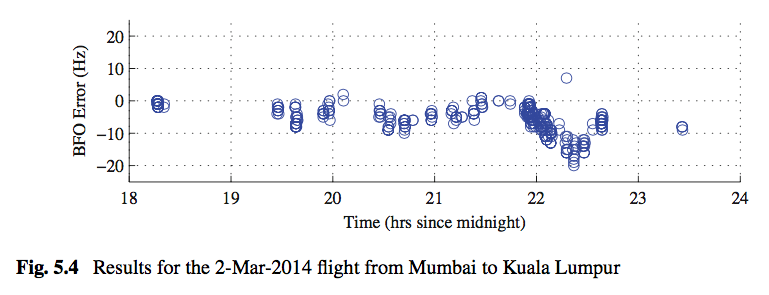
From DSTG "Bayesian Methods..." book.

Statistical estimates from manual (and tedious) data extraction from the above figure:
mean ~ -6.5 Hz standard deviation ~ 5.3 Hz
It is important to note that the flight time from Mumbai to Kuala Lumpur is a bit over five hours, so that figure 5.4 above represents essentially all of the BFO data from that particular flight. It is also important to note that statistics from all the flights of 9M-MRO looked at by the DSTG (some 20 flights in all) and summarized in Table 5.1 have an in-flight standard deviation of 5.5 Hz when outliers are included. See table 5.1 below. So, what makes figure 5.4 unique is not the standard deviation, but the mean of -6.5 Hz relative to an ensemble mean much closer to zero.
In fact, the DSTG comments relative to Figure 5.4 have more to do with the deviation from a mean close to zero and a structured bias. No comment was made relative to the standard deviation which leads one to the same conclusion above - that it was not considered abnormal.

In fact, if one were to generate representative statistics for the BFO error for 20 flights the data might very well resemble the data below.

The figure above strongly suggests that most previous analytics with highly constrained BFO errors may be suspect relative to terminal accuracy, and that the DSTG is probably correct in modeling flight paths with an emphasis on ground speed, track constraints, and BTO residuals.
The recent work of Iannello and Godfrey is among the first produced by "mainstream" analysts to relax the notion of a highly constrained BFO.
Iannello and Godfrey
See also the link below which supports the DSTG use of a nominal BFO sigma of 5Hz when computing the range of speeds and tracks at 19:40.
Midflight Speed
Afterthought
None of the above presents a challenge relative to the notion of the plane tracking South after the FMT or the hypotheses of a rapid rate of descent at 00:19. What it does challenge is the notion of accurately predicting where the plane actually went, and where the rapid descent took place.

A "blizzard" of trials below illustrate a zero ensemble mean and a variance that grows with time.

From DSTG "Bayesian Methods..." book.
Statistical estimates from manual (and tedious) data extraction from the above figure:
mean ~ -6.5 Hz standard deviation ~ 5.3 Hz
It is important to note that the flight time from Mumbai to Kuala Lumpur is a bit over five hours, so that figure 5.4 above represents essentially all of the BFO data from that particular flight. It is also important to note that statistics from all the flights of 9M-MRO looked at by the DSTG (some 20 flights in all) and summarized in Table 5.1 have an in-flight standard deviation of 5.5 Hz when outliers are included. See table 5.1 below. So, what makes figure 5.4 unique is not the standard deviation, but the mean of -6.5 Hz relative to an ensemble mean much closer to zero.
In fact, the DSTG comments relative to Figure 5.4 have more to do with the deviation from a mean close to zero and a structured bias. No comment was made relative to the standard deviation which leads one to the same conclusion above - that it was not considered abnormal.
"The bias used for the plot was obtained by analysing BFO measurements
while the aircraft was on the tarmac. The residual error is clearly not zero-mean, and
the mean varies with time."

In fact, if one were to generate representative statistics for the BFO error for 20 flights the data might very well resemble the data below.

The figure above strongly suggests that most previous analytics with highly constrained BFO errors may be suspect relative to terminal accuracy, and that the DSTG is probably correct in modeling flight paths with an emphasis on ground speed, track constraints, and BTO residuals.
The recent work of Iannello and Godfrey is among the first produced by "mainstream" analysts to relax the notion of a highly constrained BFO.
Iannello and Godfrey
See also the link below which supports the DSTG use of a nominal BFO sigma of 5Hz when computing the range of speeds and tracks at 19:40.
Midflight Speed
Afterthought
None of the above presents a challenge relative to the notion of the plane tracking South after the FMT or the hypotheses of a rapid rate of descent at 00:19. What it does challenge is the notion of accurately predicting where the plane actually went, and where the rapid descent took place.
Tuesday, September 20, 2016
Funny Stuff
Screen capture below from the "comments" section of an MH370 article by Byron Bailey which appeared today (9/21/16 Aussie time) in "The Australian".

It would seem, even based on this small sample size, that the Australian people have had enough. I agree with the commenters. The entire search has been embarrassingly mismanaged. I find myself in agreement with William. The ATSB has obviously hitched their wagon to the wrong ponies.
Search bosses ‘in a bit of a pickle’ as MH370 mystery deepens
The article is behind a paywall so I will not post a link. Interested people can figure it out.

It would seem, even based on this small sample size, that the Australian people have had enough. I agree with the commenters. The entire search has been embarrassingly mismanaged. I find myself in agreement with William. The ATSB has obviously hitched their wagon to the wrong ponies.
Wednesday, September 14, 2016
Alternate MH370 Flight Path
Motivated by the coordinates found on Shah's simulator drive, Iannello and Godrey created a flight path using McMurdo Station in Antartica as a destination point. That work can be found here:
Iannello and Godrey
An alternative possibility is a flight path using Cocos Island as a waypoint initially. After flying toward Cocos the plane, in this model, was redirected toward Exmouth, AU. The flight path from 19:40 to 00:11 is shown in Goggle Earth below (green path). The path to the Cocos is almost identical to the path to McMurdo Station. No explanation is offered for the initial path to Cocos or for the subsequent selection of Exmouth as a destination. These paths may simply have been convenient selections in the onboard waypoint menu, and suited Shah's purpose at the time.

Supporting data in spreadsheet form is provided below:

Note: Not everything in this blog is linked in the public domain, however, that does not mean the information is meant to be private. I just regard it in the category of personal notes or a personal diary. It is a convenient way for me to keep these "research ramblings" organized and not lose them in a bunch of loose papers as I am prone to do. Feel free to use anything here in any manner you wish.
Iannello and Godrey
An alternative possibility is a flight path using Cocos Island as a waypoint initially. After flying toward Cocos the plane, in this model, was redirected toward Exmouth, AU. The flight path from 19:40 to 00:11 is shown in Goggle Earth below (green path). The path to the Cocos is almost identical to the path to McMurdo Station. No explanation is offered for the initial path to Cocos or for the subsequent selection of Exmouth as a destination. These paths may simply have been convenient selections in the onboard waypoint menu, and suited Shah's purpose at the time.

Supporting data in spreadsheet form is provided below:

Note: Not everything in this blog is linked in the public domain, however, that does not mean the information is meant to be private. I just regard it in the category of personal notes or a personal diary. It is a convenient way for me to keep these "research ramblings" organized and not lose them in a bunch of loose papers as I am prone to do. Feel free to use anything here in any manner you wish.
Sunday, September 4, 2016
Indonesian Radar Coverage (Lhokseumawe)
The graphic below shows the coverage (red circle) of the Thomson-CSF TRS-2215 radar located in Indonesia at Lhokseumawe.


It is hard to reconcile how the Indonesia radar did not see MH370 when the flight path was in view of this radar from Pulau Pinang all the way to beyond the final primary radar coverage at Butterworth RMAFB located near Pulau Pinang. The overlap between the Indonesian radar and the Butterworth radar is significant, and the Malays claim the Butterworth radar tracked the plane for 200nm into the Malacca Strait. MH370 literally flew right past the Indonesian radar site.
The "presumed final major turn" location is not relevant to this discussion.
Davey, Gordon, et.al. BFO Data
Davey, Gordon, et. al. all members of The Australian Defense Science and Technology Group have published a book, Bayesian Methods in the Search for MH370, Springer 2016. The book was published as Open Access, so I am allowed to post the "duplication" below from page 30 of the book.
This book is published open access.
Open Access This book is distributed under the terms of the Creative Commons Attribution- NonCommercial 4.0 International License (http://creativecommons.org/licenses/by-nc/4.0/), which per- mits any noncommercial use, duplication, adaptation, distribution and reproduction in any medium or format, as long as you give appropriate credit to the original author(s) and the source, a link is provided to the Creative Commons license and any changes made are indicated.
The material describes the BFO error, difference between logged and calculated BFO, on a test flight described in the text accompanying the figure.
//////////////////////////////////////////////////////////////////////////////////////////////////////////////////////////////////////////////////

//////////////////////////////////////////////////////////////////////////////////////////////////////////////////////////////////////////////////
The significance of the above data is two-fold. First there are BFO errors on the order of 20Hz, and second the error is one-sided. Previously Inmarsat suggested BFO accuracy should not be assumed to be better than 7Hz (not clear if this peak, or one sigma). Analysts have been synthesizing candidate paths with low single digit BFO errors. This new data opens up the range of 7th arc solutions rather dramatically.
Open Access This book is distributed under the terms of the Creative Commons Attribution- NonCommercial 4.0 International License (http://creativecommons.org/licenses/by-nc/4.0/), which per- mits any noncommercial use, duplication, adaptation, distribution and reproduction in any medium or format, as long as you give appropriate credit to the original author(s) and the source, a link is provided to the Creative Commons license and any changes made are indicated.
The material describes the BFO error, difference between logged and calculated BFO, on a test flight described in the text accompanying the figure.
//////////////////////////////////////////////////////////////////////////////////////////////////////////////////////////////////////////////////

//////////////////////////////////////////////////////////////////////////////////////////////////////////////////////////////////////////////////
The significance of the above data is two-fold. First there are BFO errors on the order of 20Hz, and second the error is one-sided. Previously Inmarsat suggested BFO accuracy should not be assumed to be better than 7Hz (not clear if this peak, or one sigma). Analysts have been synthesizing candidate paths with low single digit BFO errors. This new data opens up the range of 7th arc solutions rather dramatically.
Tuesday, August 30, 2016
Inmarsat Data Not Useful?
Well, I beg to differ with the above supposition. The world is indeed a big place, and even a small amount of information can yield enormously useful constraints.
Start with the graphic below. While I make no claims for its precision, it is a useful approximation of the problem statement.

The graphic above shows the approximate maximum and minimum range associated with the fuel estimated to be on board MH370 at the time of the last radar contact West of Penang. The approximate radius of the maximum range, blue circle, is 2850 nm. The approximate radius of the minimum range, black circle, is 1100 nm. The red line is the 6th (00:11) Inmarsat arc.
The surface area between the maximum and minimum ranges is approximately 22 million square nautical miles. The distance along the 7th arc between 26S and 40S is approximately 1200 nm. If a very generous search width of 100 nm is used, the area of the 7th arc search as defined by the Inmarsat data is approximately 120000 square nm. It is clear that the Inmarsat data reduces the search possibilities by factor of almost 200, or a factor greater than two orders of magnitude. Two orders of magnitude is a huge reduction.
How can anyone possibly claim the Inmarsat is not extremely useful??
Start with the graphic below. While I make no claims for its precision, it is a useful approximation of the problem statement.

The graphic above shows the approximate maximum and minimum range associated with the fuel estimated to be on board MH370 at the time of the last radar contact West of Penang. The approximate radius of the maximum range, blue circle, is 2850 nm. The approximate radius of the minimum range, black circle, is 1100 nm. The red line is the 6th (00:11) Inmarsat arc.
The surface area between the maximum and minimum ranges is approximately 22 million square nautical miles. The distance along the 7th arc between 26S and 40S is approximately 1200 nm. If a very generous search width of 100 nm is used, the area of the 7th arc search as defined by the Inmarsat data is approximately 120000 square nm. It is clear that the Inmarsat data reduces the search possibilities by factor of almost 200, or a factor greater than two orders of magnitude. Two orders of magnitude is a huge reduction.
How can anyone possibly claim the Inmarsat is not extremely useful??
Sunday, August 28, 2016
Re: Iannello and Godfrey, “Possible Flight Path...”
Iannello and Godfrey
Very interesting. The narrative checks
a lot of boxes. Perhaps all of the boxes.
The points in the SIO on ZS's flight
simulator are certainly a compelling reason to believe that a flight
was simulated in that direction. Again, no hint of motive is
apparently provided by this new information. I say apparently because
it takes a little more thought, albeit speculative thought, to make
sense of it all.
Let's start with the Malay response to
the diversion in the first hour or two after the turn West near
IGARI. The response was below minimal standards. One could even
describe it as pathetic. Even the ICAO was critical of it, and that
is highly unusual for that organization(1).
Many people wondered why the response was not a “dialing until your
fingers bled” effort. A simple explanation is that the status (not
the exact location) of the aircraft was known. Third parties in KL
were attempting to negotiate concessions from the Malay leadership in
KL, with MH370 as the lever. The exact nature of those concessions
cannot be known, but there is certainly a large menu of options.
So ZS flew West from IGARI to play a
waiting game to the North and West of the Malay Peninsula – waiting
for word of success so that he could land the plane - Banda Aceh and
Car Nicobar being logical choices. That word never came, and the
“negotiation failed” response was to fly South and destroy the
aircraft in the SIO. While that action may seem extreme, it was the
only possible response. You cannot retreat from a situation like
that without carrying out the stated threat. Your chance of a
successful future negotiation is highly dependent on the other party
understanding that your ultimatums must be regarded very seriously.
So with the “negotiation failed”
result, ZS selected McMurdo Station as an AP destination, and
resigned himself to his fate. His ambition of becoming a national
hero was dashed, and he had to pay the price he knew full well was a
possible outcome of this bold plan. So why practice the route on his
simulator? Surely a pilot of his skill could execute that route
without practice. The simple and obvious answer was to indulge
curiosity. ZS wanted to know where the plane would run out of fuel,
and observe his final resting place on the planet.
The simulated route did not include the
turn near IGARI. The simulation was most likely done with the
assumption that the diversion would be performed on a route to
Europe. Scheduling and other constraints required a diversion from
the Beijing route. A European route would have been preferred, since
the diversion would not be noticed until the plane had flown well
past the Malay Peninsula.
I think the implication in the
“discussion” section of the latest IG narrative is excellent. A
logical place to look for the aircraft is where a flight path to
McMurdo crosses the Inmarsat 7th BTO arc. While the
precise location of the FMT in the actual route flown is a bit
“fuzzy”, the geometry reduces the spread in the 7th
arc crossing locations. Also the latitude of the crossing derived in
the IG narrative, ~27S, is far more consistent with the debris finds
(and lack of finds) than is ~38S.
Wednesday, August 24, 2016
More on Ping Ring Radii and Other Good Stuff
Found this data from Dr. Steel. Our values agree very closely so I'll just publish his table with attribution. Good reference, IMO, to 3F1 parameters including sat position, sat velocity, sub-satellite position on earth (Lat Lon columns), and ping ring radius (Approx Great circle distance).


Where is that Ring (18:25:27)
Wednesday, May 6, 2015
Obviously the accuracy of the handshake rings is of critical importance to the forensics related to the terminal location of MH370. My initial ring calculations (done a long time ago) were relatively "casual". The results were placed in a table which I have continued to use since. While these results have had no important bearing on modeling candidate flight paths, they would become important relative to directing search efforts or for use in comparisons with other data. One such comparison is the radar data obtained from Butterworth RMAFB. Of particular interest is the 18:25:27 ring which is very close in time to the last radar contact at 18:22. The 18:25:27 ring is quantified below.


Note: This value is correct only for analytics relatively close to the equator where the WGS84 earth radius is very close to 6378.
My ancient 18:25:27 calculation of 3630 is clearly astray by almost 100km. Not very useful for anything but flight path feasibility calculations. An earlier post made here relative to radar implications is obviously flawed, and will be revisited.
Figure 1 - GES / Satellite / Aircraft Geometry
(view is orthogonal to a plane containing R_s and (R_e +H))
Note: This value is correct only for analytics relatively close to the equator where the WGS84 earth radius is very close to 6378.
My ancient 18:25:27 calculation of 3630 is clearly astray by almost 100km. Not very useful for anything but flight path feasibility calculations. An earlier post made here relative to radar implications is obviously flawed, and will be revisited.
Friday, August 5, 2016

Tuesday, August 2, 2016

Saturday, July 30, 2016

Monday, July 4, 2016
MH370 Debris Analytics ("blue collar" version)
Elegant drift analytics have been performed by Brock McEwen, independent contributor, and Richard Godfrey of the IG.
McEwen's analytics can be found here:
Brock Study
Godrey's analytics can be found here:
Richard Study
This effort is not intended to replace or supplement the efforts linked above. It is simply another way to look at the problem. I would characterize it as being derived from common sense and complete. Complete in this context means everything is included below. Unlike the studies linked above where the heavy lifting from an analytical perspective is "under the covers", and you are presented with graphical or tabular output which cannot be checked (not meaning to imply that there is reason to believe checking is needed).
A table of the debris found as of this date (07/04/16) is presented below. Not all of these finds have been officially confirmed, but they are all compelling relative to being from 9M-MRO. No distinction is made by debris size, whether it came from the right or left side of the aircraft, or whether it was an internal or external part.

A LON - LAT scatter plot of these finds is as shown below.

Map view of debris finds below.

The finds show a significant clustering around latitude -20 to -26. Outliers are the Mossel Bay find and the most recent Pemba Island find.
Shown below is the Geomar reverse drift plot using "only" the flaperon finding on Reunion Island. Reunion Island is at -21 latitude, and is representative of the latitude of the debris clusters. I have no reason to doubt the validity of the Geomar model, and it saves the time and tedium of watching which way rubber ducks travel across the ocean.

It is clear from the Geomar graphic the preferred origin of the Reunion find is along the coast of Sumatra/Java. It can be inferred that other finds in the vicinity of latitude -20 to -26 would have a similar origin. It is reasonable to conclude, based on the Geomar model, that the 9M-MRO terminus lies between latitude -10 and -20 on or near the 7th arc.
The debris data lends absolutely no support to the current area being searched by the ATSB. The fact that no debris has been found on the coast of Western Australia further supports the notion that the current search area is not correct.
Edits July 7, 2106 - DW
Since posting the above on the JW blog several comments have been made by people with relatively little technical background or a flawed background that "beg" for additional commentary here.
First is the notion of forward and reverse drift calculation. All calculations are by definition reverse calculations since the objective of the calculation is the origin of the debris not the terminal locations of the debris which comprise the set of knowns. Now it is possible to use algorithms which reverse the forcing functions to arrive at a hypothetical starting point. It is also possible to use forcing functions that operate in the forward direction and use them act on debris at a variety of starting points and subsequently cataloging the results.
Second is the notion that additional debris finds add confusion and difficulty to drift calculations, especially in the reverse direction. The reality is that more data provides more constraining information that actually serves to "focus" possible starting points. More information is always better, that is an axiom of information theory as well as Kalman filtering.
Third is the notion that the new Geomar study should be used, and the above study to be discarded. I deliberately used the above study because it addresses the debris clusters at ~20S directly. No one, including Geomar, has indicated that the above study is flawed. Debris found at Pemba Island and Mossel Bay can only narrow the findings of the above study, not broaden them. A common metric in navigation mathematics is the notion of "dilution of precision". A narrow string of debris location latitudes significantly dilutes the precision that could be obtained if the debris were more scattered with respect to latitude. This statement applies particularly to the North-South precision of the starting point.
McEwen's analytics can be found here:
Brock Study
Godrey's analytics can be found here:
Richard Study
This effort is not intended to replace or supplement the efforts linked above. It is simply another way to look at the problem. I would characterize it as being derived from common sense and complete. Complete in this context means everything is included below. Unlike the studies linked above where the heavy lifting from an analytical perspective is "under the covers", and you are presented with graphical or tabular output which cannot be checked (not meaning to imply that there is reason to believe checking is needed).
A table of the debris found as of this date (07/04/16) is presented below. Not all of these finds have been officially confirmed, but they are all compelling relative to being from 9M-MRO. No distinction is made by debris size, whether it came from the right or left side of the aircraft, or whether it was an internal or external part.

A LON - LAT scatter plot of these finds is as shown below.

Map view of debris finds below.

The finds show a significant clustering around latitude -20 to -26. Outliers are the Mossel Bay find and the most recent Pemba Island find.
Shown below is the Geomar reverse drift plot using "only" the flaperon finding on Reunion Island. Reunion Island is at -21 latitude, and is representative of the latitude of the debris clusters. I have no reason to doubt the validity of the Geomar model, and it saves the time and tedium of watching which way rubber ducks travel across the ocean.

It is clear from the Geomar graphic the preferred origin of the Reunion find is along the coast of Sumatra/Java. It can be inferred that other finds in the vicinity of latitude -20 to -26 would have a similar origin. It is reasonable to conclude, based on the Geomar model, that the 9M-MRO terminus lies between latitude -10 and -20 on or near the 7th arc.
The debris data lends absolutely no support to the current area being searched by the ATSB. The fact that no debris has been found on the coast of Western Australia further supports the notion that the current search area is not correct.
Edits July 7, 2106 - DW
Since posting the above on the JW blog several comments have been made by people with relatively little technical background or a flawed background that "beg" for additional commentary here.
First is the notion of forward and reverse drift calculation. All calculations are by definition reverse calculations since the objective of the calculation is the origin of the debris not the terminal locations of the debris which comprise the set of knowns. Now it is possible to use algorithms which reverse the forcing functions to arrive at a hypothetical starting point. It is also possible to use forcing functions that operate in the forward direction and use them act on debris at a variety of starting points and subsequently cataloging the results.
Second is the notion that additional debris finds add confusion and difficulty to drift calculations, especially in the reverse direction. The reality is that more data provides more constraining information that actually serves to "focus" possible starting points. More information is always better, that is an axiom of information theory as well as Kalman filtering.
Third is the notion that the new Geomar study should be used, and the above study to be discarded. I deliberately used the above study because it addresses the debris clusters at ~20S directly. No one, including Geomar, has indicated that the above study is flawed. Debris found at Pemba Island and Mossel Bay can only narrow the findings of the above study, not broaden them. A common metric in navigation mathematics is the notion of "dilution of precision". A narrow string of debris location latitudes significantly dilutes the precision that could be obtained if the debris were more scattered with respect to latitude. This statement applies particularly to the North-South precision of the starting point.
Tuesday, June 28, 2016

Sunday, April 10, 2016

Subscribe to:
Posts (Atom)